Comprehensive Guide to SEO Through Regression Analysis


Comprehensive Guide to SEO Through Regression Analysis
Regression Analysis for SEO
Google is adamant that there is no way to “beat” their search algorithms. The fact is these algorithms are nothing more than mathematical equations that do have common threads. Granted they are very complex algorithms with hundreds of years worth of man hours that have gone into them. Nevertheless, statistical methods that allow us to approximate an unknown equation with a similar equation. This blog post will break down a few statistical methods that Fruition uses to improve our client’s SEO. If you’re interested in more basic SEO FAQs we’ve assembled a few dozen of the most frequently asked search engine optimization questions.
The Important Stuff First
Fruition’s statistical models tell us that several known variables are still important. Those are:
- H1 tags,
- The importance, format, and density of title tags change a lot for different searches, site traffic is important, and
- Over optimization of anchor text is a killer. Those of course are just a few of the tidbits that we know. The following paragraphs lay the groundwork for how we come to make those statements.
Linear Regression for SEO
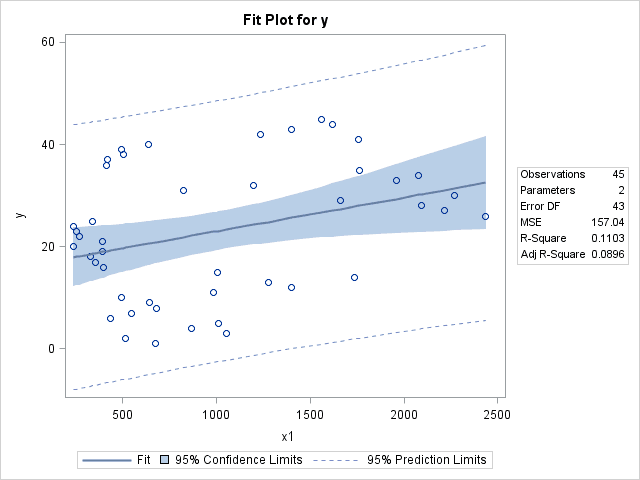
The most limited and easily understood version of this method is linear regression. In linear regression we find the “best” line through the data. Essentially, we find the line that passes closest to all of the points in a dataset simultaneously. Linear regression is generally taught as a freshman level college course. Here at Fruition we have been using advanced statistical models to focus our client’s SEO budgets on the variables that we can impact and produce the most likely positive impact on rankings. Some of the things our statistical models have uncovered are the over optimization of anchor text and the increased importance of social media and page speed on a website’s rankings. This blog post explains some basic and intermediate level statistics that you can apply to your search marketing efforts. Figure 1 shows the results of a simple regression analysis conducted using SAS. The line represents the best available line through all of the data. Notice how the line is not very close to many of the points it represents. This is due to a poor fit. On the table “R-Square” = 0.1103. The R square value indicates that this line accounts for only 11.03% of the variability in the data points. We would hope for a value closer to 1, which would indicate a near perfect fit. We look for around .3 as a general rule since values between .05 and .2 can indicate no relationship at all. Linear Regression Analysis for SEO
Figure 1 – Linear Regression for SEO
In SEO we all agree that there is more than one variable which determines the overall rank of a site. Multiple Linear Regressions allows us to add more predictor variables. With more variables new issues arise. We need the variable to be independent of each other (otherwise we may find a high R square value due to overlapping variables). The line now travels through “n-space” no longer is the line a two dimensional thing to be shown on paper. Rather for every variable, there is another dimension. For 3 variables the line would be in 3-D. But for more than three it is difficult to fathom what the line ”looks” like.
Multiple Linear Regression for SEO
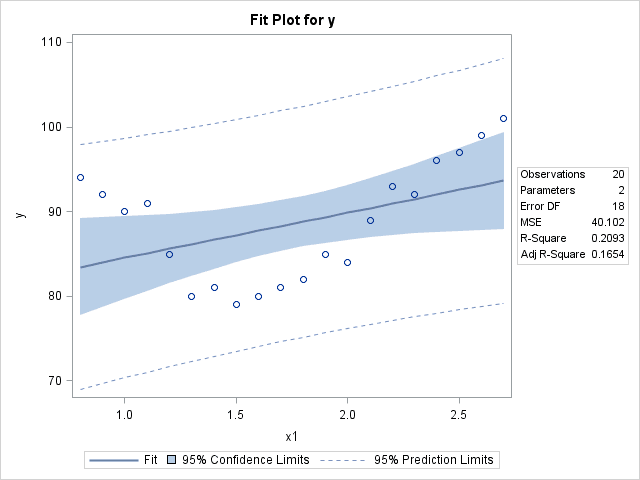
In the context of Search Engine Optimization (SEO), Multiple Linear Regression doesn’t really work for two reasons. First, linear regression assumes that the dependent variable (in this case site rank) is measured on an interval scale. Second, linear regression assumes a straight line relationship, where in reality some variables are good, up to a point and then they are bad, the line would be curved. Interval data means that the distance between the first and second ranked variable is the same as the distance between the fourth and fifth variable etc… As an example consider how we measure height, a six foot person is taller than a five foot person by the same distance as a five foot person is taller than a four foot person, all inches are the same length. Site rank is measured on only an ordinal scale, where the first is better than the second and so on, but there is nothing known about the distance between them. The best example of ordinal is education level, we know a J.D. requires more study than an M.S., however, is the distance between a J.D. and an M.S. the same as the distance between a B.S. and an M.S.? I can attest that it is not. As applied to the SEO world, the distance between the quantity of links built and the quality of onsite content is not for sites that are ranked from position 1 to 2 and 2 to 3, etc. The shape of the relationship between the predictor variables and the dependent variables establishes if a variable changes (actual site rank is the dependent variable and the other variables like keyword count are the predictors). For instance, the easiest type of spam to spot is having the keyword on a webpage 100,000 times. A keyword count of 100,000 is way too much, but not having the keyword at all is also bad. Somewhere in between 0 and 100,000 we find a good spot for many variables. Table 2 shows a simple example of a curvilinear relationship. In the example note that R²=.2093, which isn’t horrible, but look at the points. There is a clear relationship, but it isn’t a straight line, so linear regression cannot find it. Statistics for SEO
Figure 2 – Advanced Statistics for SEO
Logistic Regression for SEO
We now move to a more appropriate model. Logistic regression in itself solves the first issue with linear regression as applied to SEO. Logistic regression does not assume the data are measured on an interval scale. This single change brings with it other changes in the way the results are interpreted and the information we can derive from the model. Logistic regression is driven by a concept called an odds ratio. Odds are simply the ratio of the probability of success divided by the probability of failure. Here success and failure simply refer to getting what you are looking for. In a horse race, a given horses odds are the probability the horse will win, divided by the probability it will lose. So odds of 3:1, or just 3, indicate the horse is three times as likely to win as it is to lose.
Odds Ratio
An odds ratio is the odds of a variable being in a category divided by the odds of the same variable being in the next lower category. An odds ratio (Θ) of one indicates the variable is equally likely to fall in either category. Θ<1, indicate the variable is more likely to be in the lower category, and Θ>1 indicates the variable is more likely to be found in the higher category. In the context of SEO this is useful because we can split the rankings up into categories; say the top 20 results, the next 20 results and so on for the top 100 or so. Then we can look at various variables and see if the odds ratio of a given variable lends itself to improving rank.
Issues with Linear Regression for SEO
The second issue with linear regression for SEO is more difficult to address. Each variable needs to be individually analyzed so its shape can be determined manually. Once the shape is known, we move forward by watching for values that are either too large or too small. Finding Bad Variables As applied to SEO logistic regression then is a useful method in ruling out bad variables. The trick is that like all regression analysis, logistic regression is a correlational study, meaning that the results can never say which variables actually cause rank to improve; we merely get to see which variables are related to rank. The actual variables causing rank to improve are the variables Google measures. We can now try to establish a list of variable to approximate Google’s algorithm. The remaining issue is that many of the variables available are closely related to one another.
How to Use Regression Analysis for SEO
Taking this information you can break down how we root out which variables are useful to work on and which are simply closely related to the variables that actually do impact a website’s ranking in Google or Bing. Here at FRUITION, we use this data to focus our SEO work on client’s websites to maximize their budget. If you spend time working on variables that are either out of reach or produce a minimal impact you are just throwing away the money. It is very similar to bidding on the right keywords.
What are additional models to consider for SEO?
-
Decision Trees and Random Forests: Decision tree algorithms can model more complex, non-linear relationships, which might be appropriate for SEO data. Random forests, which combine the predictions of many decision trees, can often achieve better performance.
-
Gradient Boosting Machines (GBMs): Like random forests, GBMs are an ensemble method that can model complex relationships. However, GBMs build trees in a sequential manner, learning from the mistakes of previous trees. This can sometimes result in better performance, at the cost of increased computational complexity.
-
Deep Learning: Deep learning models, such as artificial neural networks, can model very complex relationships and learn features automatically from raw data. However, they require a large amount of data to train, and their predictions can be difficult to interpret.
-
Reinforcement Learning: If you frame your SEO tasks as a sequential decision-making problem (e.g., deciding when to update content, when to acquire backlinks, etc.), reinforcement learning could be appropriate. Reinforcement learning algorithms learn a policy, or set of rules, for making decisions that maximize some notion of cumulative reward.
-
Natural Language Processing (NLP) models: Some SEO tasks, like keyword extraction or content optimization, could benefit from NLP models. Transformer-based models like BERT, GPT-4, or newer ones provide great capabilities in understanding and generating text data.